
The SiteRead report, section by section
A SiteRead report is a PDF that checks your block against public government data and explains what was found in plain English. Here's what each section covers, with maps from a sample report.
About the sample. The sample is a made-up 0.72 ha block in the Adelaide Hills, drawn to show a typical rural result. It isn't a real property or listing.
- Map and key findings
- Planning zone
- Overlays
- Bushfire, vegetation and water
- Terrain
- Building area and water flow
- Heritage
- Infrastructure
- Services
- Next steps
- Sources and limitations
Map and key findings
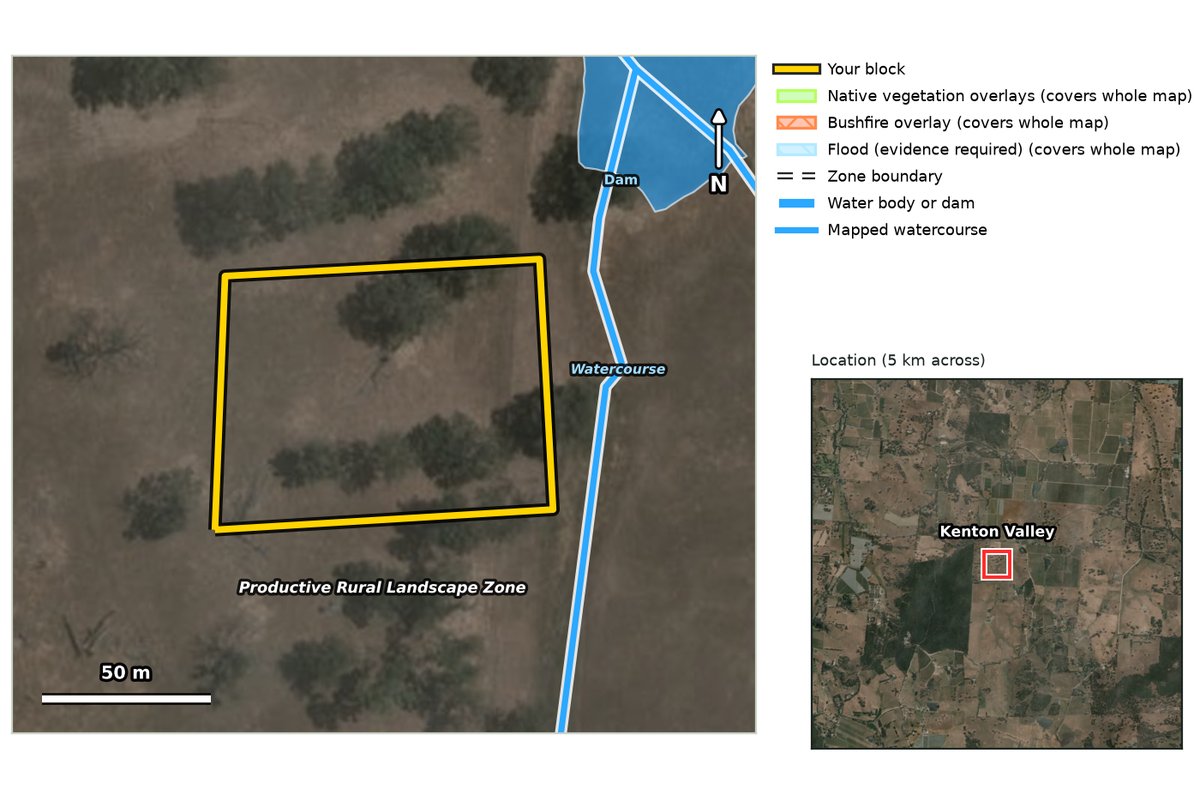
Your boundary on one map with the planning zone, overlays, watercourses, dams, pipelines and railways drawn on, plus a short list of the findings that matter most.
In the sampleA mapped watercourse runs 11 m east of the block and a dam sits 30 m to the north-east. The block is in the Productive Rural Landscape Zone.
Planning zone
The Planning and Design Code zone that covers your block, how much of the block it covers, and what the zone is mainly intended for. The zone sets the kinds of development that are expected and how an application is assessed.
In the sampleProductive Rural Landscape Zone over the whole block.
Planning and Design Code overlays
Every overlay that touches the block. Overlays add rules on top of the zone for things like hazards, heritage, character, water and native vegetation. Each one comes with a plain-English note on what it usually means.
In the sampleEight overlays, including Hazards (Bushfire – Medium Risk), Hazards (Flooding – Evidence Required), Native Vegetation, Limited Land Division and the Mount Lofty Ranges Water Supply Catchment.
Bushfire, vegetation and water
The Bushfire Protection Area risk level used for building rules, mapped native vegetation, and watercourses and dams on or near the block. Satellite imagery from the last few years adds ground features such as standing water, seasonally wet ground and bare soil.
In the sampleMedium bushfire risk over the whole block. No native vegetation mapped on the block. No open water or seasonally wet ground picked up by satellite.
Terrain
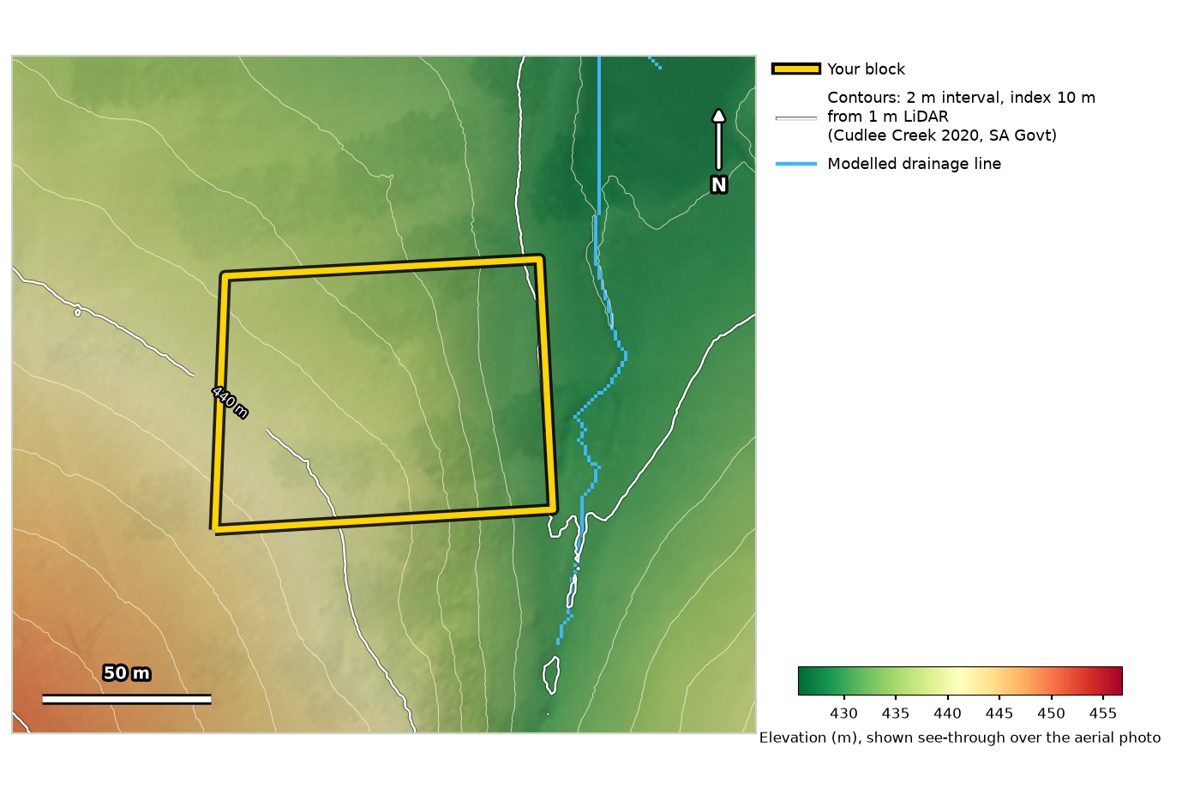
Height range, slope, which way the land faces, contours and winter sun across the block, from the best elevation data available. Where 1 m LiDAR covers the site the report uses it; elsewhere it uses 5 m data. The report says which was used.
In the sample1 m LiDAR. The block rises about 13 m from 430 m to 443 m, with an average slope of 7°. About a third faces north.
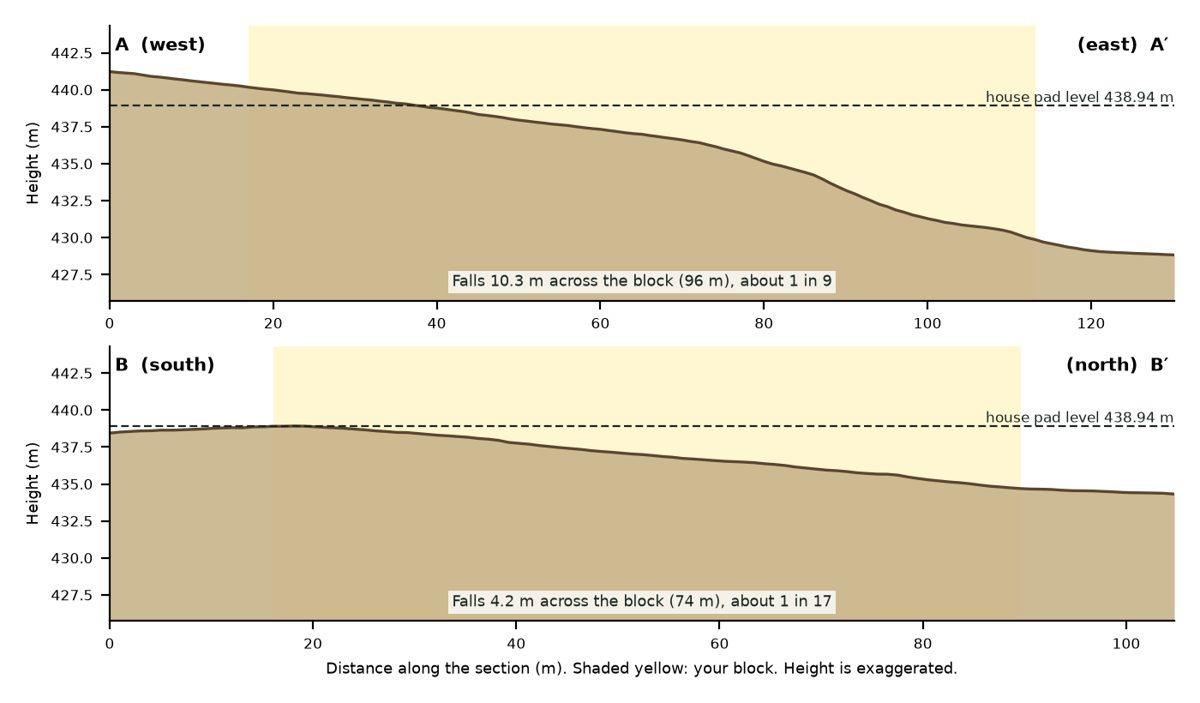
Building area, water flow and slope profile 1 m LiDAR areas
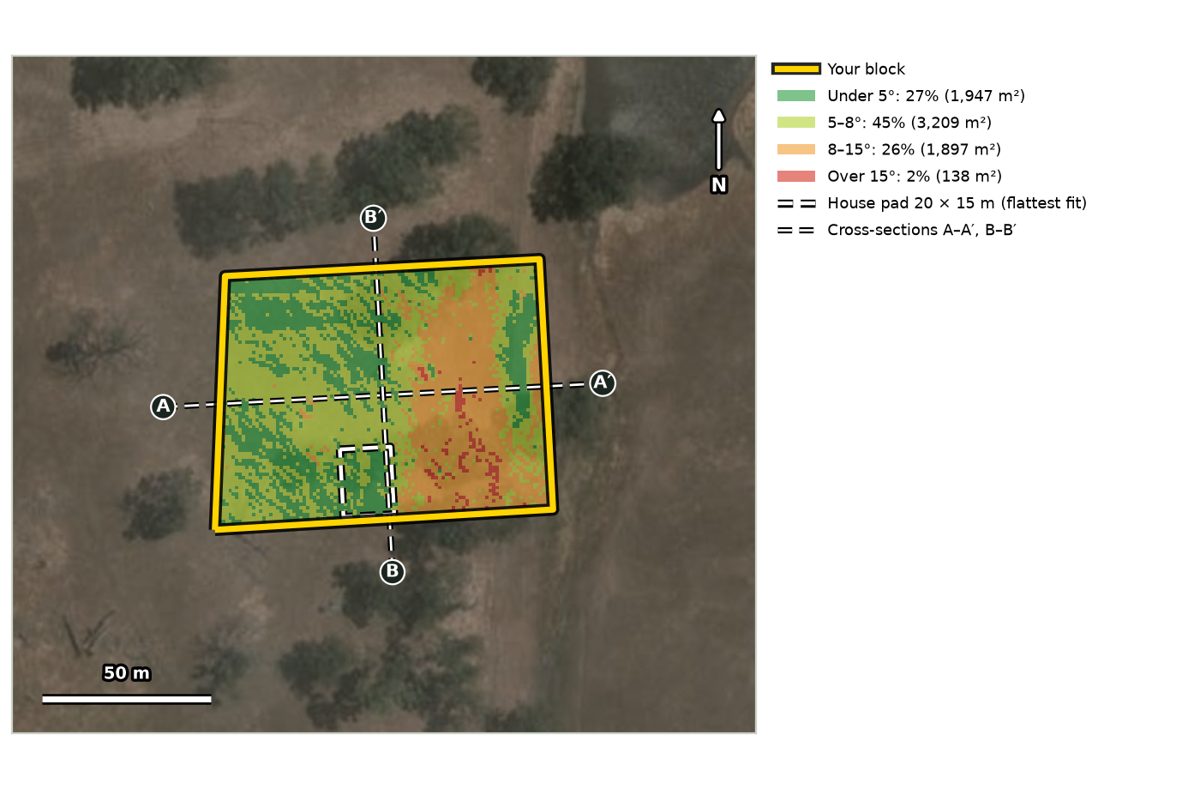
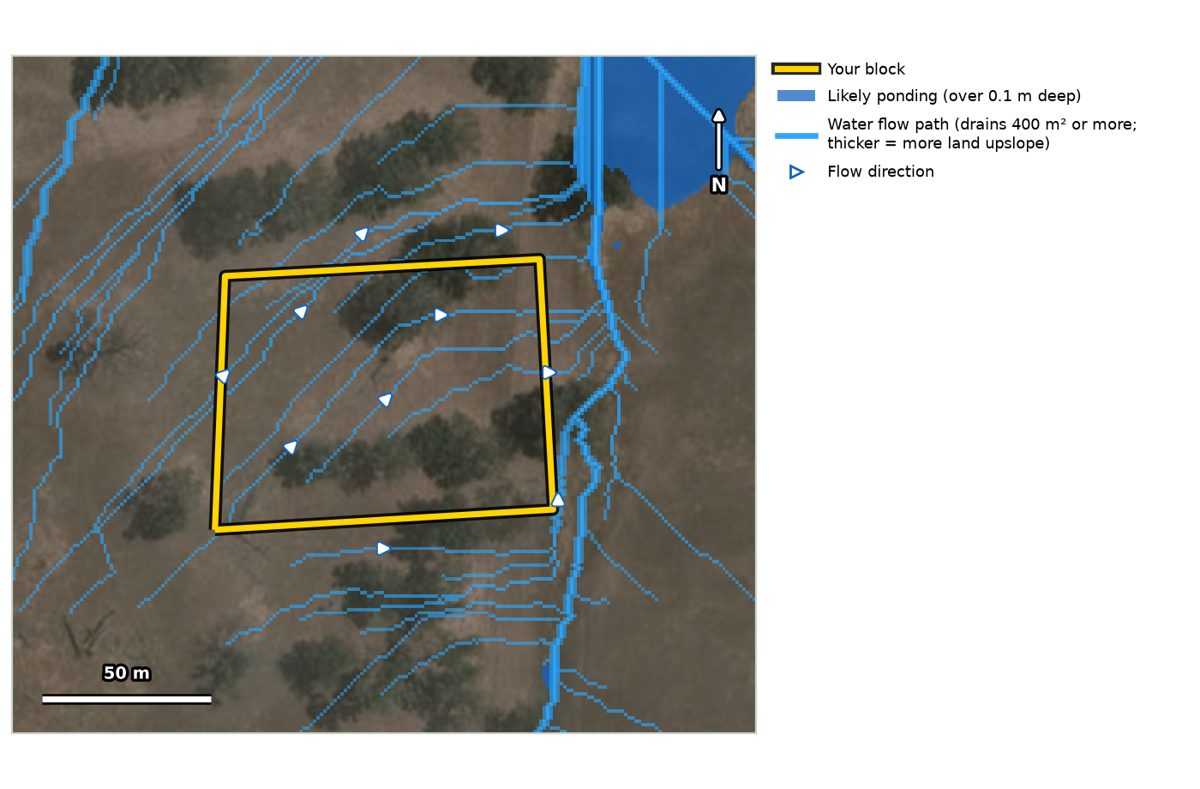
Where the ground is flat enough to build, the flattest place for a typical 20 × 15 m house pad and the cut and fill it would need, where water flows across the block and where it could pond, and height profiles across the block.
The building area, house pad and water flow maps need 1 m LiDAR, so they're included only where it covers the site. Check the coverage on the order map. Slope profiles are included for every block.
In the sample27% of the block is under 5° and 45% is 5–8°. The best house pad needs about 48 m³ of cut and 48 m³ of fill, with under 1 m of cut or fill at any point. Water enters from the west, and no ponding spots were found.
Heritage
State Heritage Places and heritage overlays on or near the block. Aboriginal sites and objects aren't mapped publicly, so the report explains how to request a search of the Register of Aboriginal Sites and Objects.
In the sampleNo State Heritage Places mapped on or near the block.
Major infrastructure near the block
High-pressure gas and petroleum pipelines and railways from open government data, with the distance, direction and who owns them. Power lines, water mains and local services aren't shown, so the report reminds you to lodge a free Before You Dig request, which gets plans from SA Power Networks, SA Water and other asset owners.
In the sampleNo pipelines or railways within 500 m, and a reminder to lodge a Before You Dig request.
Distance to services
Straight-line distance to the nearest regional town, government school and public hospital. Some sources give school locations only as a distance band.
In the samplePublic hospital 4.8 km away. Government primary school within 5 km.
Recommended next steps
A checklist based on what was found, such as asking council about an overlay, getting a Bushfire Attack Level (BAL) assessment, a geotechnical or survey check, or a register search, with who to contact for each.
Data sources and limitations
Every dataset used, with its source, date and licence. Data comes from SA Government (Location SA, Planning and Design Code, Department for Environment and Water), Geoscience Australia and Digital Earth Australia. Anything that couldn't be checked for your block is listed, along with what public data can't tell you.
SiteRead is a screening report, not a substitute for council advice, a survey, engineering or soil assessments, or a title search. See our terms of use.
Get the report for your block
Draw your boundary on the map. A site screen ($55 inc GST) is built automatically and emailed to you as soon as it's ready. With the consultant review ($175 inc GST, data pack included), a GIS consultant checks it first and we email it within two business days.